Infra-red Spectroscopy
Infra-red spectroscopy is used by organic chemists to help them identify compounds. The atoms joined by chemical bonds in molecules vibrate, (imagine two atoms joined by a spring). Strong bonds vibrate at a higher frequency (faster) and heavier atoms make the bond vibrate at a lower frequency (slower). Every bond has its own unique natural frequency which is in the infra-red region of the electromagnetic spectrum.
As well as stretching, bonds can also bend. Since the energies involved with the bending will be different for each kind of bond, each different bond will absorb a different frequency of infra-red radiation. Therefore, some groups can have different absorption peaks.
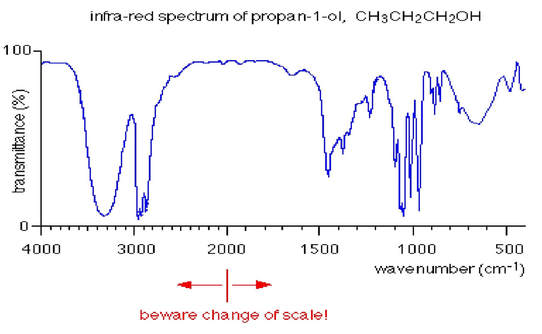
A graph is produced showing how the percentage transmittance varies with the frequency of the infra-red radiation.
Pay close attention to the change in the scale of the x axis. Some scales will all be even, others will look a little odd. Different machines will give different scales, but this does not matter as long as you read the scale correctly.
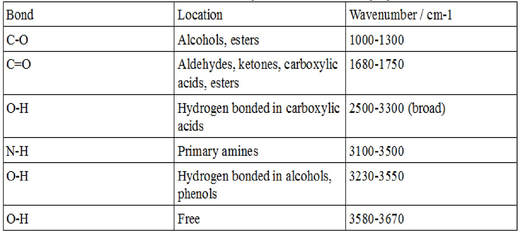
Here are some common absorption peaks:
One of the other uses of infra-red is to find out how a reaction is proceeding. Spectra can be taken at various intervals during the reaction, for example a primary alcohol being oxidised to an aldehyde. This would produce a spectra which at the start would show a strong peak at around the 3300 cm-1 region, and at the end show a strong peak at around the 1750 cm-1 region. It is still very difficult to name a compound on IR spectra alone, and they are often used in tandem with other spectra, such as Mass Spectrometry and UV Spectroscopy. Next up are three examples to help you understand how to use this table to identify your sample.
Ethanoic acid as an example
Ethanoic acid has the structure:
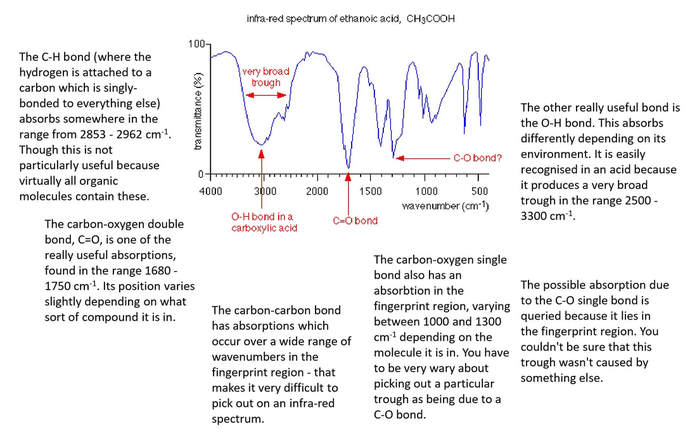
You will see that it contains the following bonds:
carbon-oxygen double, C=O
carbon-oxygen single, C-O
oxygen-hydrogen, O-H
carbon-hydrogen, C-H
carbon-carbon single, C-C
The carbon-carbon bond has absorptions which occur over a wide range of wavenumbers in the fingerprint region -that makes it very difficult to pick out on an infra-red spectrum.
Ethanol as an example
Ethanol has the structure:
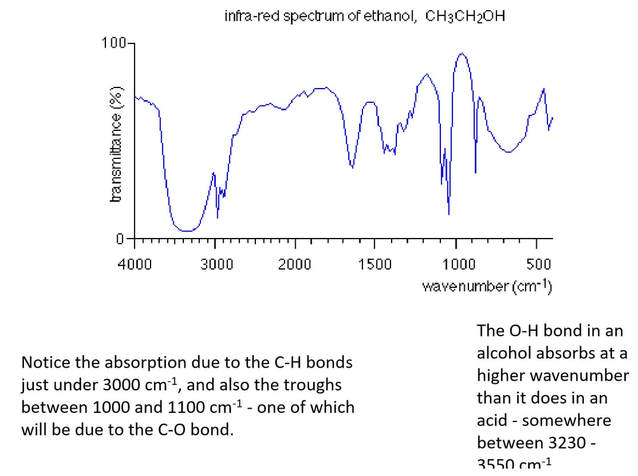
You will see that it contains the following bonds:
carbon-oxygen single, C-O
oxygen-hydrogen, O-H
carbon-hydrogen, C-H
carbon-carbon single, C-C
As before, the carbon-carbon bond has absorptions which occur over a wide range of wavenumbers in the fingerprint region which makes it very difficult to pick out on an infra-red spectrum.
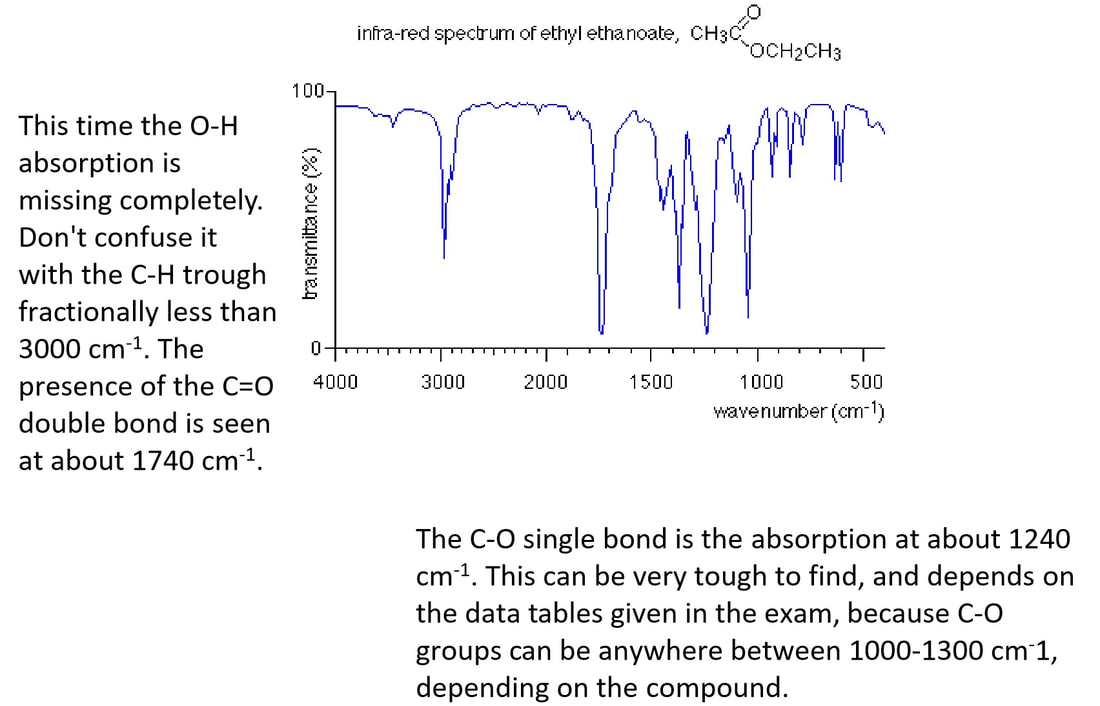
Ethyl ethanoate as an example
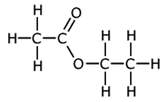
Ethyl ethanoate has the structure:
You will see that it contains the following bonds:
carbon-oxygen double bond, C=O
carbon-oxygen single, C-O
carbon-hydrogen, C-H
carbon-carbon single, C-C

